
Page 384 - TransAT_Tutorial_Manual
P. 384
TransAT Tutorial Manual 9.2. Forced Convection in an Isothermal Pipe
• Click to view or edit the UDF
• Repeat the above steps for the second UDF, called crossflow output, which is located under
Entry Point \ Simulation End type of template
Finally, confirm that both of the UDFs can be compiled by clicking . The output of com-
pilation will be shown in the text box in the bottom half of the window.
Once the simulation finishes running, the crossflow output.dat and streamwise output.dat data
files containing different profiles will be generated.
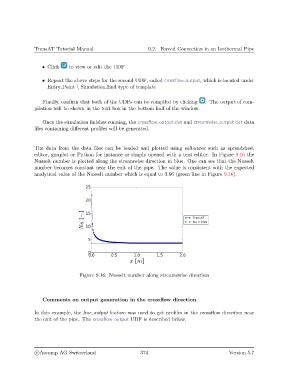
The data from the data files can be loaded and plotted using softwares such as spreadsheet
editor, gnuplot or Python for instance or simply opened with a text editor. In Figure 9.16 the
Nusselt number is plotted along the streamwise direction in blue. One can see that the Nusselt
number becomes constant near the exit of the pipe. The value is consistent with the expected
analytical value of the Nusselt number which is equal to 3.66 (green line in Figure 9.16).
Figure 9.16: Nusselt number along streamswise direction
Comments on output generation in the crossflow direction
In this example, the line output feature was used to get profiles in the crossflow direction near
the exit of the pipe. The crossflow output UDF is described below.
c
Ascomp AG Switzerland 374 Version 5.7