
Page 154 - TransAT_Tutorial_Manual
P. 154
TransAT Tutorial Manual 4.2. Sloshing
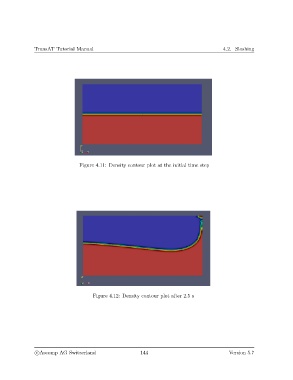
Figure 4.11: Density contour plot at the initial time step
Figure 4.12: Density contour plot after 2.5 s
c
Ascomp AG Switzerland 144 Version 5.7