
Page 92 - TransAT_Tutorial_Manual
P. 92
TransAT Tutorial Manual 2.3. Flow in an obstructed pipe
• In the box below, enter U ∗ iHat + V ∗ jHat. See Figure 2.12.
• Click .
• Choose variable Velocity from the drop-down list to color the slice with the velocity mag-
nitude.
• Make sure that the Slice is made invisible and the calculator is made visible by clicking
on the respective icon.
• In the Pipeline Browser, highlight the Calculator by clicking it once and then click in
the menu bar (alternatively, you can select Filters − > Common − > Glyph).
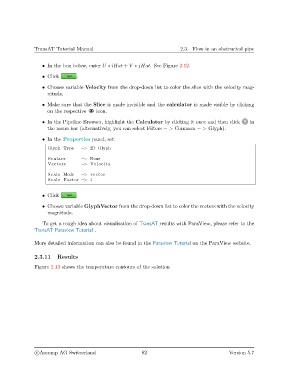
• In the Properties panel, set:
Glyph Type −> 2D Glyph
Scalars −> None
Vectors −> Velocity
Scale Mode −> vector
Scale Factor −> 1
• Click
• Choose variable GlyphVector from the drop-down list to color the vectors with the velocity
magnitude.
To get a rough idea about visualisation of TransAT results with ParaView, please refer to the
TransAT Paraview Tutorial .
More detailed information can also be found in the Paraview Tutorial on the ParaView website.
2.3.11 Results
Figure 2.13 shows the temperature contours of the solution
c
Ascomp AG Switzerland 82 Version 5.7