
Page 393 - TransAT_Tutorial_Manual
P. 393
TransAT Tutorial Manual 9.2. Forced Convection in an Isothermal Pipe
• Choose variable T in the variable drop-down list. The temperature distribution along the
domain should be shown.
• Clicking the rainbow button on the left-hand side shows the legend. Clicking the double-
arrow button on its right rescales the color range to the data range.
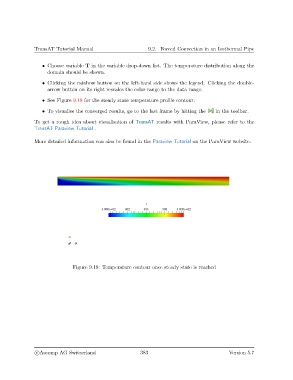
• See Figure 9.18 for the steady state temperature profile contour.
• To visualise the converged results, go to the last frame by hitting the in the toolbar.
To get a rough idea about visualisation of TransAT results with ParaView, please refer to the
TransAT Paraview Tutorial .
More detailed information can also be found in the Paraview Tutorial on the ParaView website.
Figure 9.18: Temperature contour once steady state is reached
c
Ascomp AG Switzerland 383 Version 5.7