
Page 196 - TransAT_Tutorial_Manual
P. 196
TransAT Tutorial Manual 4.5. Spillway
• Go to the RESULT folder and choose <projectname>...vtm for 3D visualization.
• Click on .
• To visualize only the fluid domain, Select Filters − > Common − > Clip. Use:
Clip Type: Scalar
Scalars: EmbI
Value: 0
Check Inside Out. Click OK Then use Clip Type: Scalar
Scalars: PhaseAlpha2
Value: 0.05
• This shows the volume fraction distribution of water (larger than 5%) in the simulated
domain.
• Play the animation by hitting in the toolbar.
To get a rough idea about visualisation of TransAT results with ParaView, please refer to the
TransAT Paraview Tutorial .
More detailed information can also be found in the Paraview Tutorial on the ParaView website.
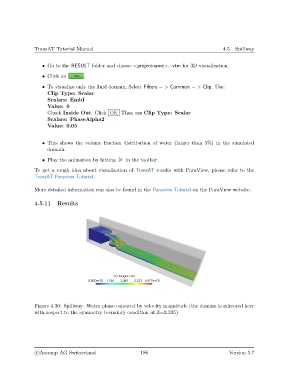
4.5.11 Results
Figure 4.30: Spillway: Water phase coloured by velocity magnitude (the domain is mirrored here
with respect to the symmetry boundary condition at Z=2.335)
c
Ascomp AG Switzerland 186 Version 5.7