
Page 424 - TransAT_Tutorial_Manual
P. 424
TransAT Tutorial Manual 10.2. Natural Convection in a Square Cavity at Ra = 10 6
• Clicking the rainbow button on the left shows the Legend. Clicking the double-arrow button
on its right rescales the color range to the data range.
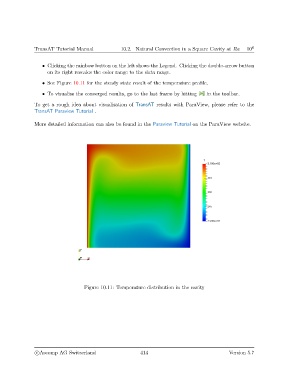
• See Figure 10.11 for the steady state result of the temperature profile.
• To visualise the converged results, go to the last frame by hitting in the toolbar.
To get a rough idea about visualisation of TransAT results with ParaView, please refer to the
TransAT Paraview Tutorial .
More detailed information can also be found in the Paraview Tutorial on the ParaView website.
Figure 10.11: Temperature distribution in the cavity
c
Ascomp AG Switzerland 414 Version 5.7